NAR: Pending Home Sales Edge Up in November
CNBC: US pending home sales rise 0.2 percent
Calculated Risk: Pending Home Sales Index increased 0.2% in November
Forbes: Pending Home Sales Tick Up In November, First Time In Five Months
Reuters: U.S. pending home sales end slide, hint at stabilization
Fox Business News: Pending Home Sales Rise Slightly, Miss Street View
One Headline Title Stood Out
Zero Hedge: Pending Home Sales Plunge At Fastest Pace Since April 2011
It took about one second to understand the discrepancy.
All but the ZeroHedge headline (not necessarily the articles) ignored the NAR statement (see first link) "The Pending Home Sales Index,* a forward-looking indicator based on contract signings, inched up 0.2 percent to 101.7 in November from a downwardly revised 101.5 in October, but is 1.6 percent below November 2012 when it was 103.3."
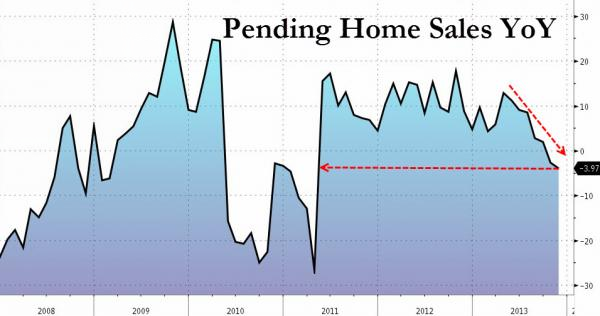
ZeroHedge has a chart that shows just that.
Pending Home Sales Year-Over-Year
It's kind of easy for sales to be up when the previous month was revised lower. But how much lower? The NAR did not even say. Let's take a look at monthly NAR reports to find out.
November 25 NAR: October Pending Home Sales Down Again, but Expected to Level Out: The Pending Home Sales Index,* a forward-looking indicator based on contract signings, slipped 0.6 percent to 102.1 in October from an upwardly revised 102.7 in September, and is 1.6 percent below October 2012 when it was 103.8. The index is at the lowest level since December 2012 when it was 101.3; the data reflect contracts but not closings.
October 28 NAR: Pending Home Sales Continue Slide in September: The Pending Home Sales Index,* a forward-looking indicator based on contract signings, fell 5.6 percent to 101.6 in September from a downwardly revised 107.6 in August, and is 1.2 percent below September 2012 when it was 102.8. The index is at the lowest level since December 2012 when it was 101.3; the data reflect contracts but not closings.
September 26 NAR: Pending Home Sales Decline in August: The Pending Home Sales Index,* a forward-looking indicator based on contract signings, eased 1.6 percent to 107.7 in August from a downwardly revised 109.4 in July, but remains 5.8 percent above August 2012 when it was 101.8; the data reflect contracts but not closings. Pending sales have been above year-ago levels for the past 28 months.
August 28 NAR: July Pending Home Sales Slip: The Pending Home Sales Index,* a forward-looking indicator based on contract signings, declined 1.3 percent to 109.5 in July from 110.9 in June, but is 6.7 percent above July 2012 when it was 102.6; the data reflect contracts but not closings. Pending sales have stayed above year-ago levels for the past 27 months.
Note the October data (released November 25) showed the pending home sales index slipped a reported 0.6 percent to 102.1.
"Pending Home Sales Rise"
- Last Month: 102.1
- This Month: 101.7
- Result: Rise of 0.2
With all this revisionist history, these month-over-month comparisons seem rather meaningless. The chart posted by ZeroHedge shows the real story.
Lawrence Yun, the NAR cheerleader had this to say "We may have reached a cyclical low because the positive fundamentals of job creation and household formation are likely to foster a fairly stable level of contract activity in 2014".
Absolutely nothing suggests a cyclical low. The recovery has been fueled by excessively low rates, that are now rising sharply. Numerous headwinds blow strongly. I strongly disagree with Yun on jobs and household formation.
Five Housing Headwinds
- Prices Up (Housing Less Affordable)
- Interest Rates Up (Housing Less Affordable)
- Insufficient Wage Growth (Housing Less Affordable)
- Household Formation Poor (Lack of Buyers)
- Poor Job Growth (Lack of Buyers)
For further discussion of headwinds, especially the rise in interest rates, please see Average 30-Year Mortgage Rate Hits 4.47% (Not Counting Fees); Affordability Check
For a report on Household Formation, please see Haircut Deficit: Kids Living in Basements a Drag on U.S. Services Spending.
Mike "Mish" Shedlock
http://globaleconomicanalysis.blogspot.com
No comments:
Post a Comment